Principal Component Analysis (PCA) 102
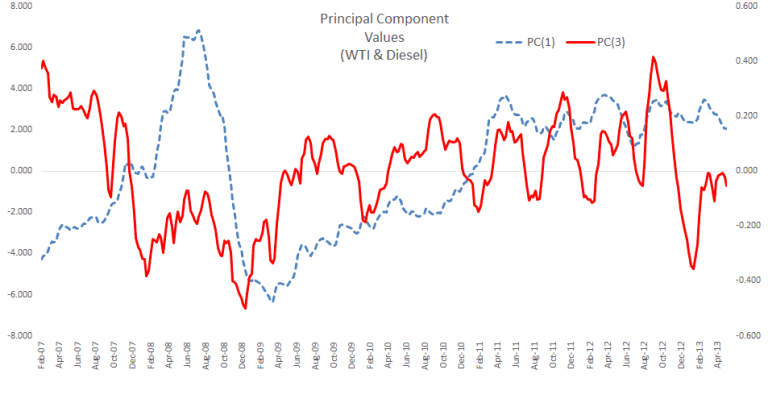
This article continues the PCA in Excel series, examining dimension reduction from 5 PCs to 3 PCs without significant information loss.
Home » Factors Analysis
Read through the articles related to Factors Analysis and its application in time series analysis.

This article continues the PCA in Excel series, examining dimension reduction from 5 PCs to 3 PCs without significant information loss.

In this study, we examine the daily prices of the first four (4) contracts of WTI CL futures listed on NYMEX, compute the number of days to the delivery month for each contract, and carry out principal component analysis (PCA) in an attempt to uncover the core drivers behind the futures curve changes (i.e. level and general shape).

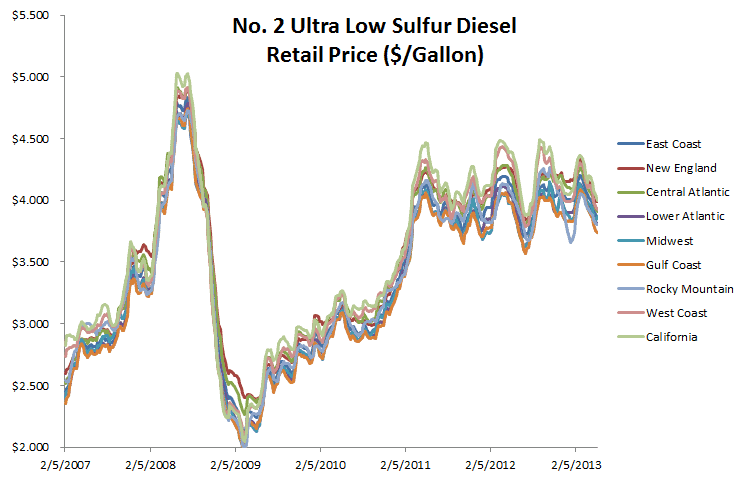
In this case, we examine the highway retail price ($/Gallon) for “No.2 Ultra Low Sulfur (0-15 ppm) Diesel” in the EIA nine (9) PADD regions and carry on principal component analysis in an attempt to find a minimal subset of the principal components that capture (or explains) the variation (spreads) in prices across different regions with a minimal loss of information.

In this paper, we will apply simple linear regression to calculate the CAPM beta for two technology stocks: Microsoft (MSFT) and IBM, then validate the model’s assumptions, identify influential data-points (e.g. outlier), ensure structural stability over the data sample, and make adjustments.

This article shows NumXL trend in excel function NxTrend, these curve functions are linear, polynomial, logarithm, power